People-First Transformation
| Objective
Transform Optimum’s Product Development function from good to great by putting people first, defining what great looks like for every job, and giving every employee an objective path to achieve it.
| Team Leads
Product Development Senior Leadership Team
Human Resources: Alicia Hartmann
| Insights
People were over 80% of the company’s investment in Product Development.
Previous transformations started from process or technology changes that were intended to pull through the other elements of the business. The CEO’s strategy was to start with people, creating a culture that is receptive to process and technology improvements and equipped to make them a reality together.
Product Development employee engagement was 77% in the Q4 2023 Voice of the Employee survey – a quarter of the function didn’t want to be part of the team.
There was no objective talent assessment. Hiring, promotion, and performance decisions relied on the judgment of individual managers.
People in the same jobs and levels didn’t have consistent titles or spans of control.
There were fuzzy anecdotes about people not being fit to role.
Employees did not have a clear picture of what was expected at their level or what was needed to reach the next one.
Some jobs needed to increase their capabilities for Product Development to better meet business needs. The people in those jobs needed to hear, clearly and respectfully, that the business required more competencies from them to achieve its goals.
Hiring for subjective “fit” over objective “signal” is expensive. Recruiting, interviewing, and onboarding a new teammate cost > $25K in opex, before counting the impact of a bad hire on morale, velocity, and quality.
The workforce transformation needed to be self-funded by finding and eliminating Product Development budget inefficiencies.
| Hypothesis
By defining what great looks like and anchoring talent decisions in clear, competency-based evidence, we ensure optimal fit to role, equitable career progression and higher quality hires that will accelerate organizational execution.
| Vision & Ways of Working
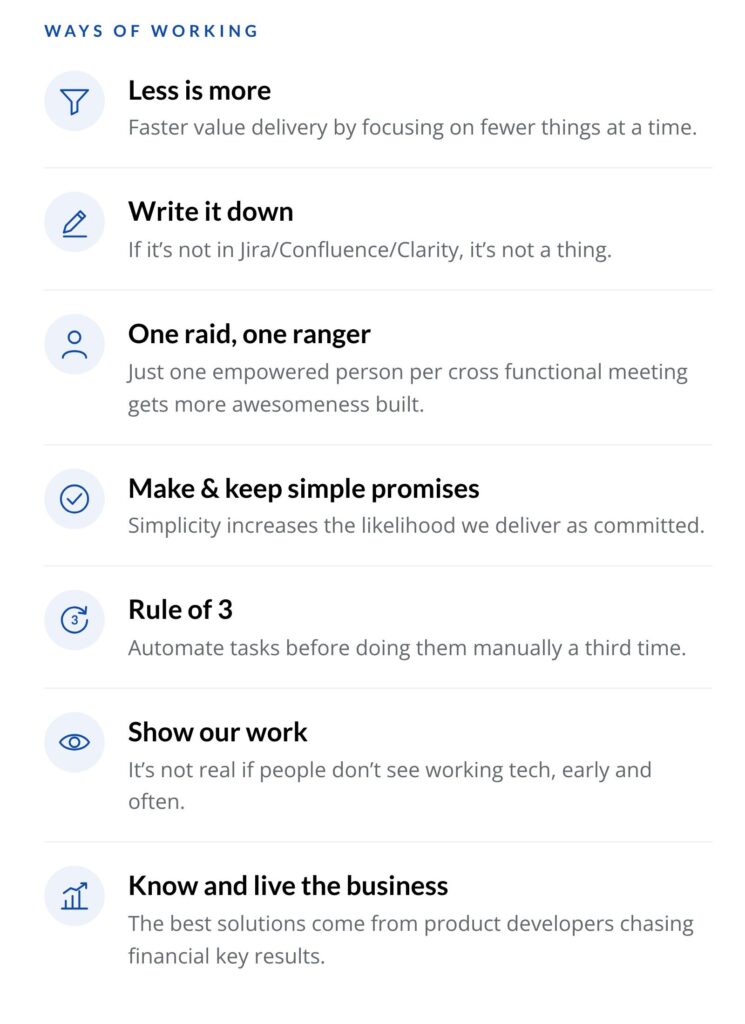
The transformation was guided by a motto, “Engage the Heart. To Inspire the Head. To Move the Feet.” Before changing any processes or technologies, Product Development aligned on a vision and ways of working. They were needed in tandem: the vision described where we were going together, and the ways of working articulated how our function would get there.
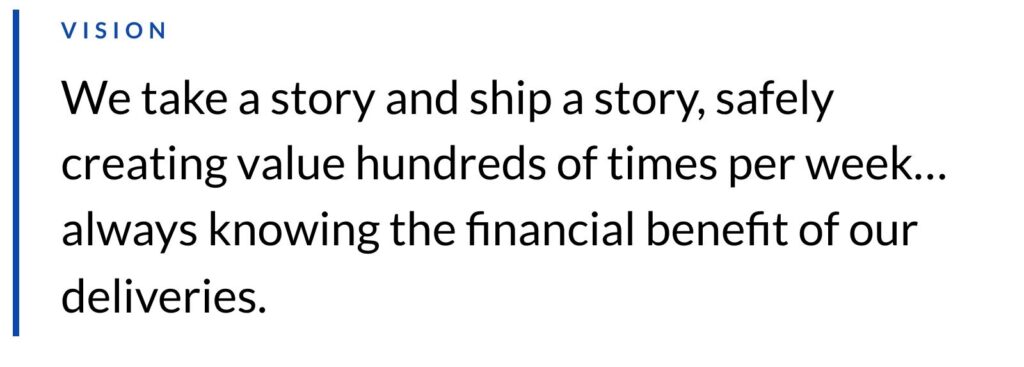
The Optimum CTPO Pact’s 10 behaviors were combined with Product Development’s Vision and Leveling Guide to create the shared foundation necessary for culture transformation.
Some of the principles, behaviors, and competencies needed to achieve the vision were already happening, while others were non-existent.
In March 2024, we started infusing these ways of working into our day-to-day. Collectively, we spent less time in meetings and more time building, and each month we delivered more while causing fewer production incidents.
The transformation was planned to progress through the Forming, Storming, Norming, and Performing stages. Iterative change management activities were completed in partnership with HR Business Partners.
Product Development’s goal was to reach Norming in 2025 and Performing in 2026 by combining this rigorous talent management with comprehensive automation of product discovery, delivery, and operations.
| Leveling Guide
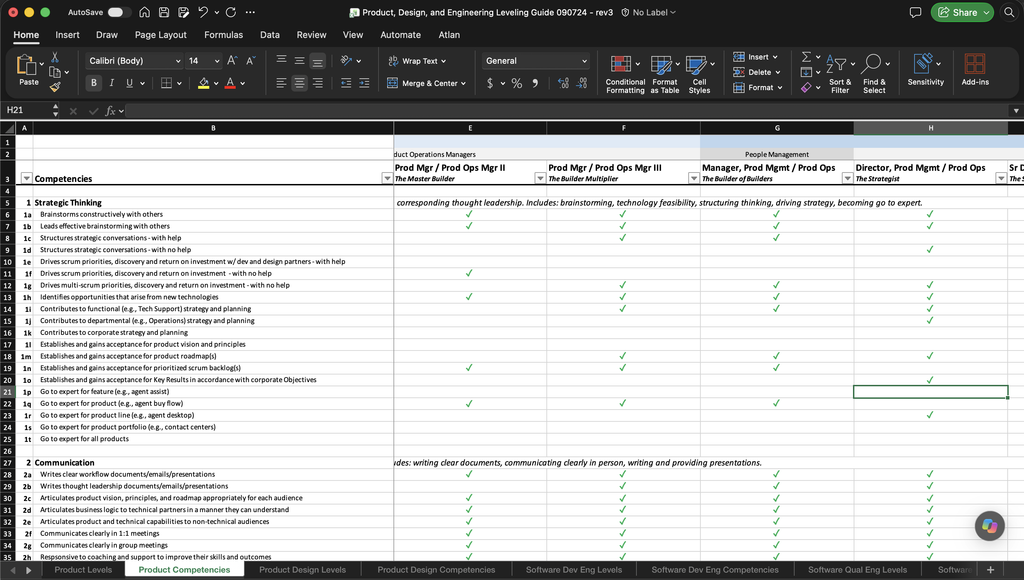
With our vision and ways of working providing a shared “where are we going” and “how we will get there,” the Job Leveling Guide shows “what it will take” from each of us to become a delivery machine. By clearly defining the hard and soft skills we expect, we set norms at every level for what people need to bring every day for each other and our customers.
The guide covers 8 sub-job families to increase the precision of talent calibration:
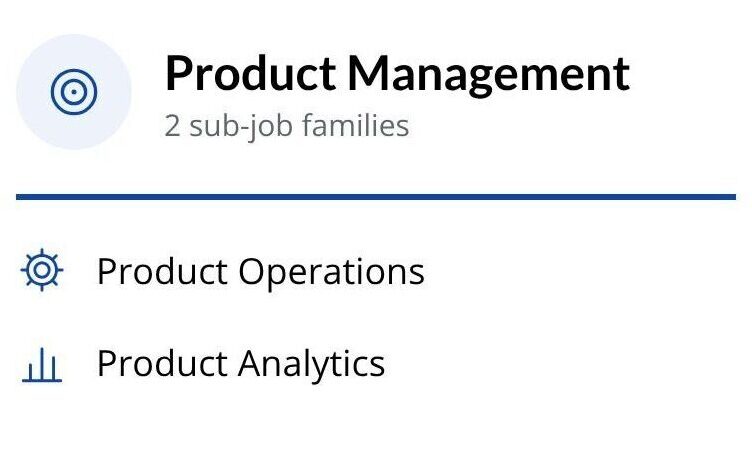
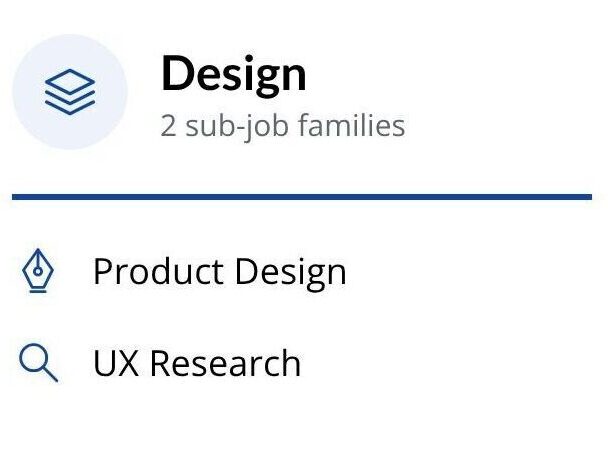
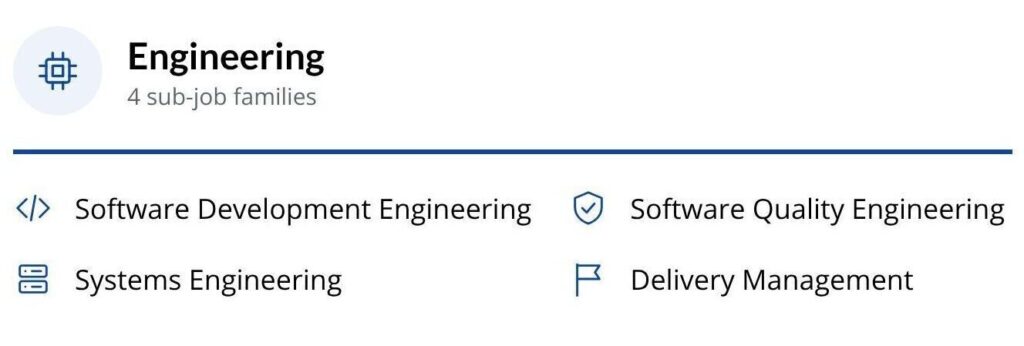
It contains 8 levels from Intern to Senior Vice President with titles normalized to similarly situated technology companies to map to the market, working to improve hiring top of funnel (e.g., Lead Programmer Analyst to Software Development Engineer II).
Each guide has 7-9 categories of ~20 competencies each. Nearly 9 in 10 competencies are shared with at least one other job family, and more than a third are common to product, design, and engineering alike, concentrated in Communication, Collaboration, Management, and Strategic Thinking. The differences are the technical craft of each job.
Common competencies are intended to facilitate cross functional collaboration and latticing with unique skills creating deeper subject matter expertise.
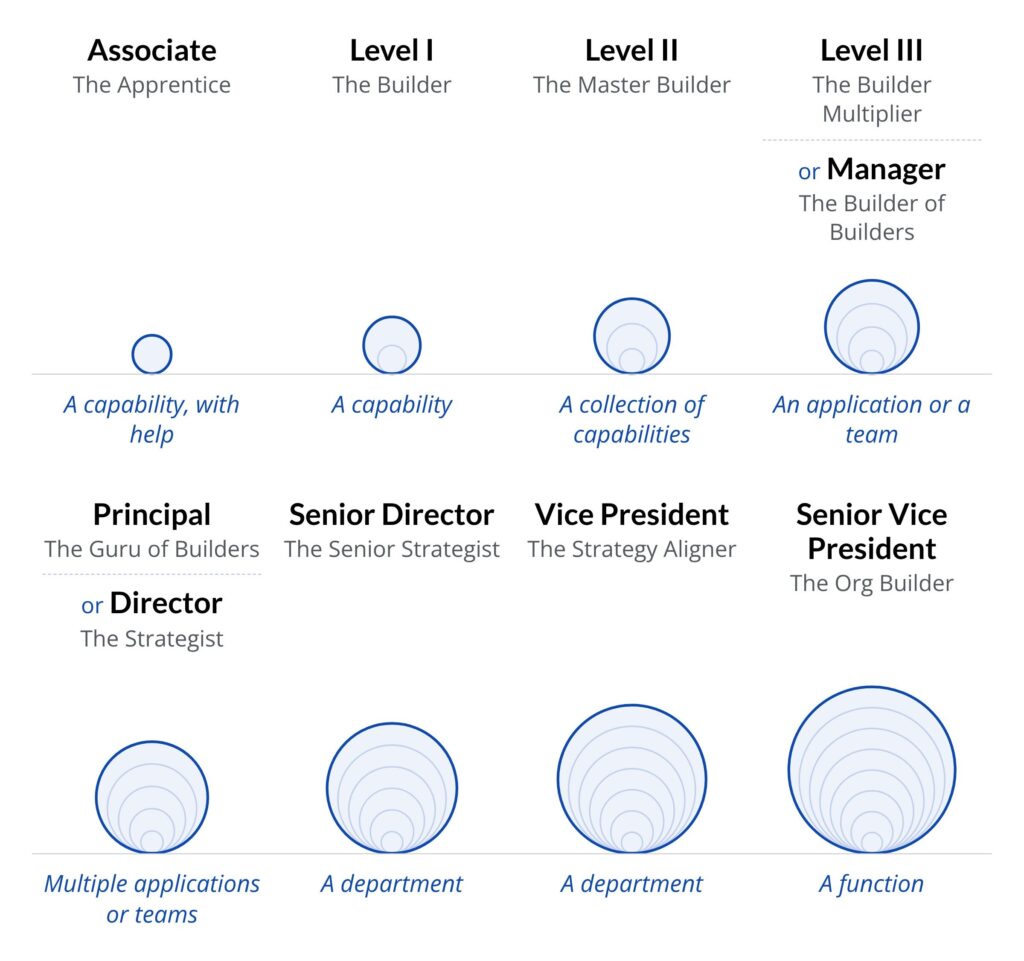
Competencies beyond the art and science of product, design, and engineering jobs are valuable additions to the function. “The Magic” competencies can include financial planning, logistics, SaaS vendor, contact center operations, and many others. The associated experiences enable Product Development to better empathize with customers.
The competencies were authored to facilitate attaching artifacts that provide evidence of meeting the expectations. Evidence is gathered by the employee and their leadership, as well as by teammates across Optimum.
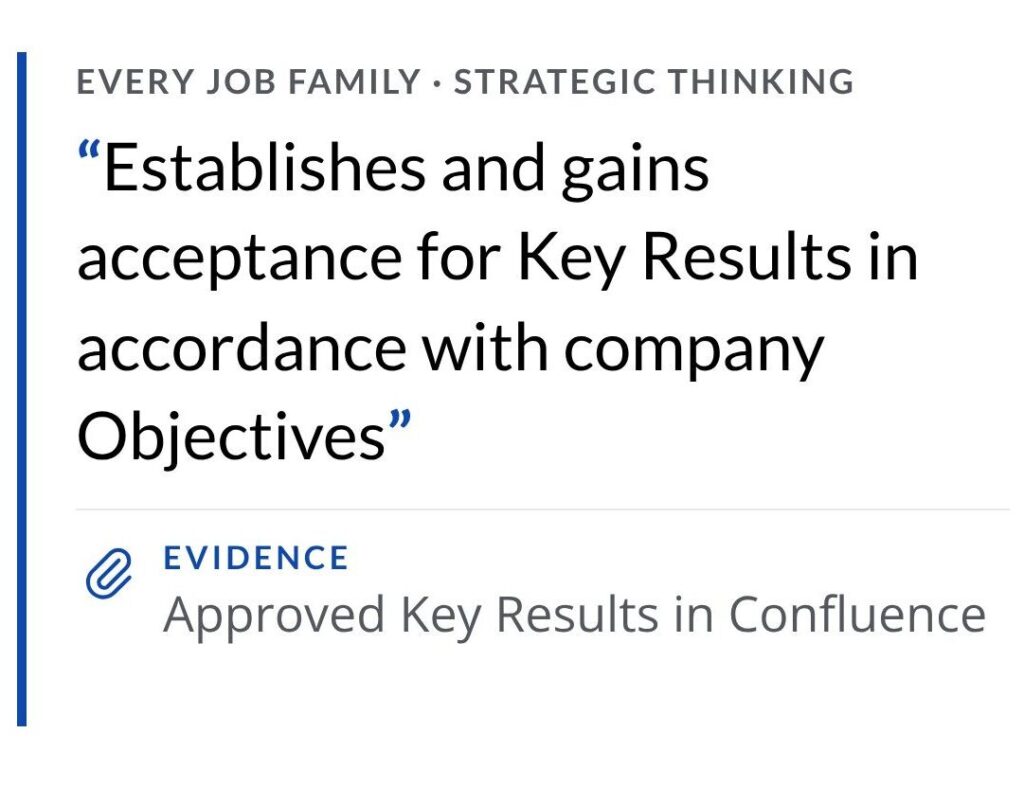
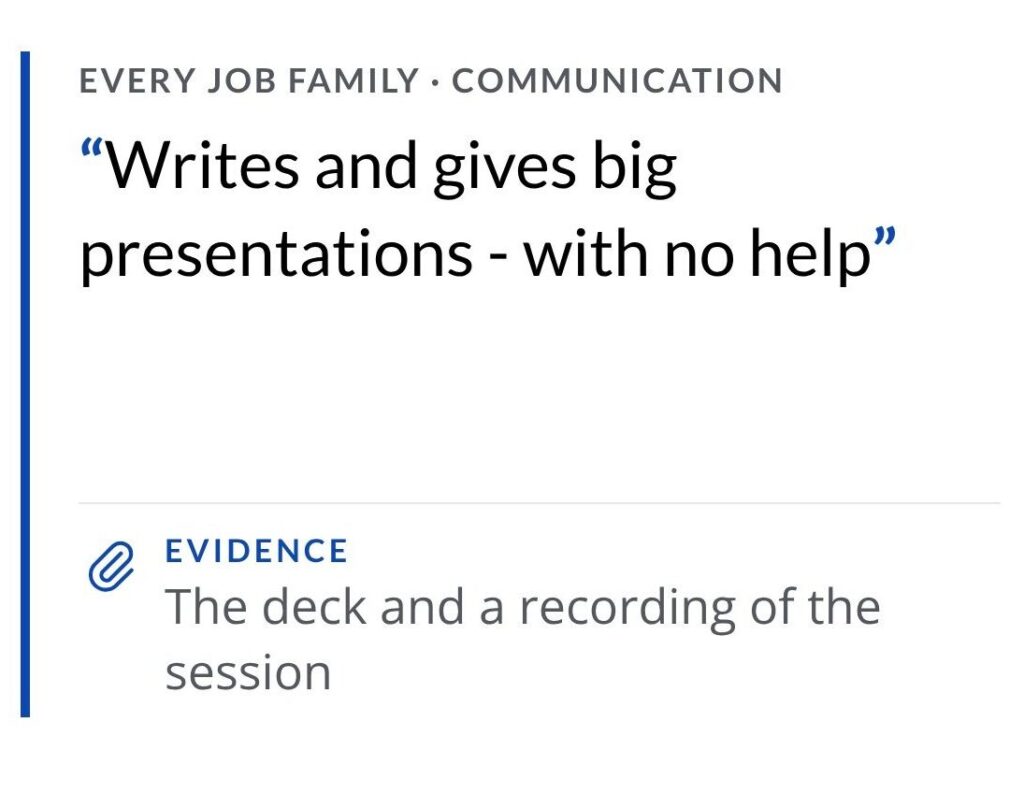
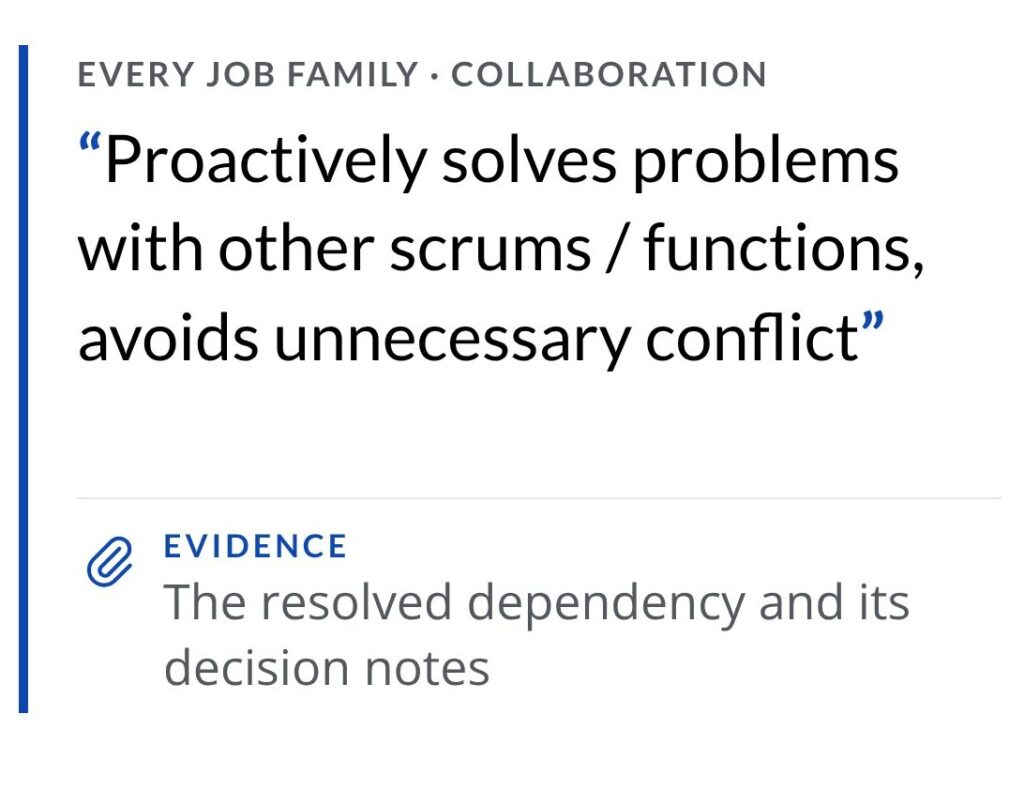
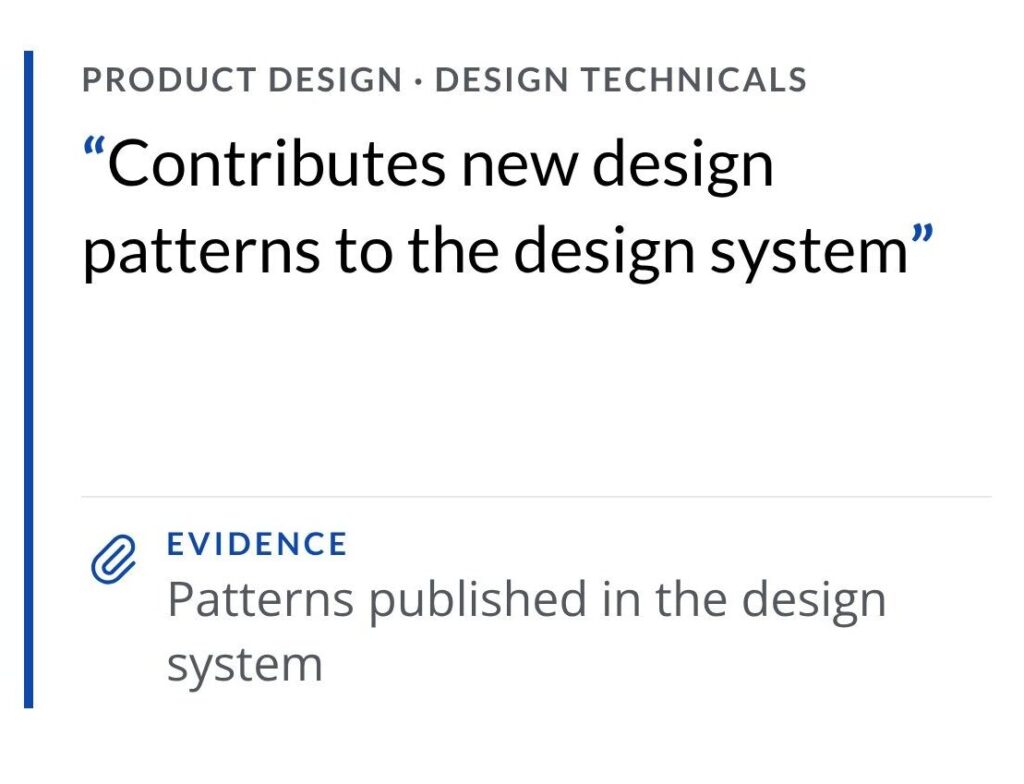
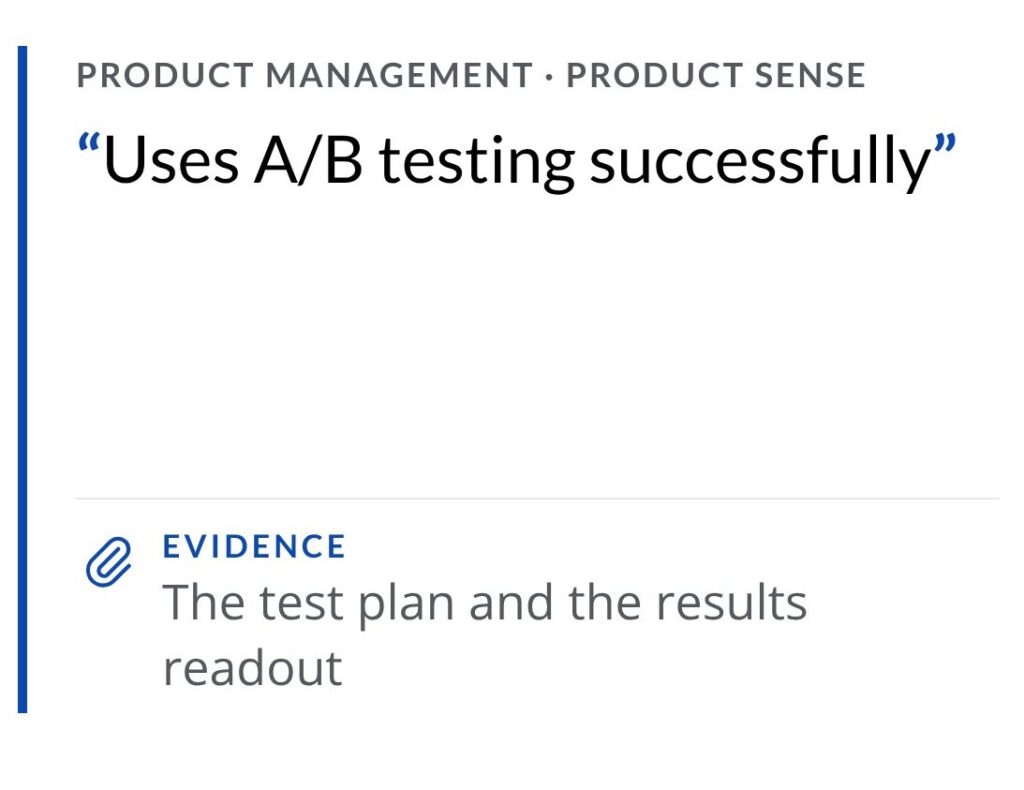
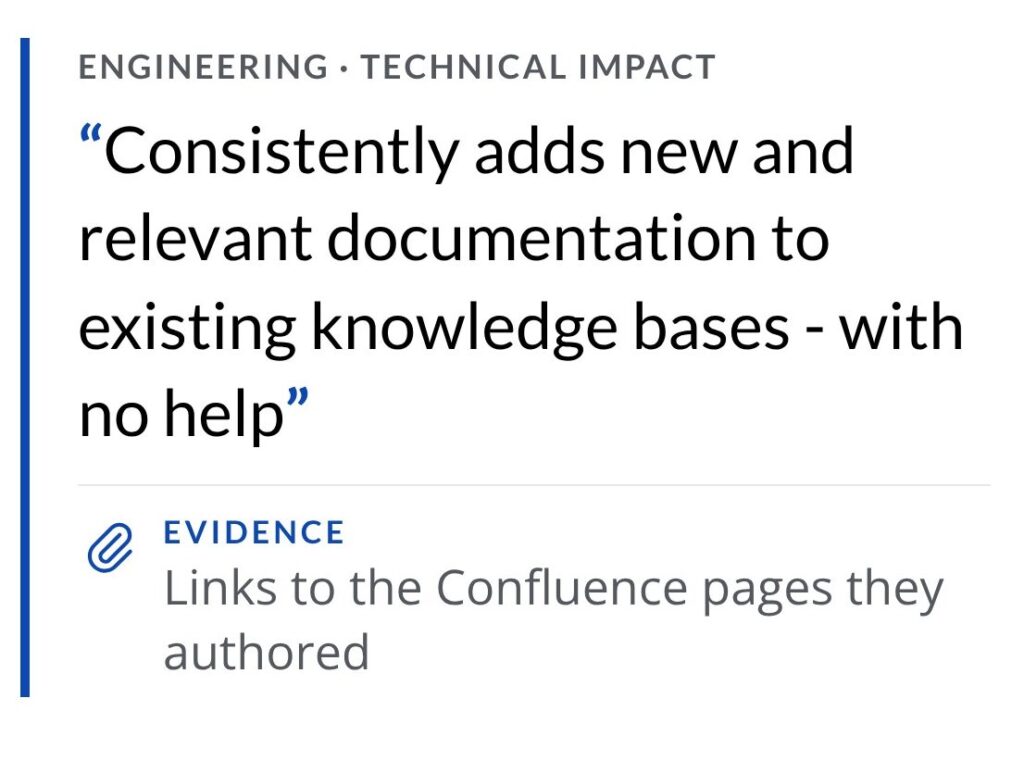
Demonstrating >80%-85% of a job’s competencies is considered meeting expectations. Evidence of meeting 100% of a current job’s expectations, plus competencies from the next level, is considered exceeding expectations. Employees who are new to role gather evidence but are not calibrated until they have completed one full cycle.

Bar raisers were transparently highlighted. Expectations for SDE IIIs and Principal Engineers were raised to align with the market, and Product Operations were raised to encompass the full sub-job family. People in bar-raised jobs met expectations at 37% of competencies for the first year, while all new hires had to meet the new standard.
| Change Management
A 90-day listening tour in Q1 2024 gathered the data that shaped a Leveling Guide built specifically for Optimum. HRBP and Legal approved the final draft.
In May 2024, Product Development and HRBP began rolling out the company’s first Leveling Guide to speed up our transformation. Director+ leaders ran the first calibration, using fact-based observations to set a talent baseline for every employee, competency by competency.
In Q3, Managers+ refined that baseline together and added evidence of each employee’s competencies. Learning by doing aligned leadership faster and sharpened the guide before full rollout. HRBP mapped the old, inconsistent titles to new standardized ones, and no one was demoted or promoted.
In September, Managers and Directors got talking points and FAQs to introduce the guide to their teams. The month ended with an all-employee meeting that launched the guide and the new titles for 2025 performance agreements.
From October to December, everyone practiced with the guide. Feedback increasingly used its shared language, and employees gathered their own evidence for the year’s last calibration.
| Objective Talent Assessments
◦ The focus of the processes is to mitigate 9 assessment biases, including affinity, halo, horns, recency, and contrast bias.
◦ Product Development completes 3 talent calibration cycles annually. Employees continually gather evidence. Each new piece of evidence accepted by a supervisor is an opportunity to discuss development plan progress.
◦ The managers gather to provide peer feedback in their Director team, which is rolled up to the Vice Presidents for department-wide calibration. Each cycle ended with calibration across Product Development departments.
◦ All jobs are posted internally and externally using job descriptions created only from the competencies of the job’s level.
◦ Interview panels are constituted to gather evidence of assigned competency categories, with 2 interviewers in each 60-minute session using standardized S.T.A.R. prompts. At the debrief, the candidate with the most evidence beyond 80% of the expected competencies based on enumerated reasons to hire and reasons not to hire, is selected.
◦ To move to a more senior job or lattice, employees interviewed as part of the same slate as external candidates. If the employee had been working the guide and exhibiting competencies from the next job, it was highly likely they would be hired over people from outside the function, and they were promoted into a job they had already been doing for several months.
| Retrospective
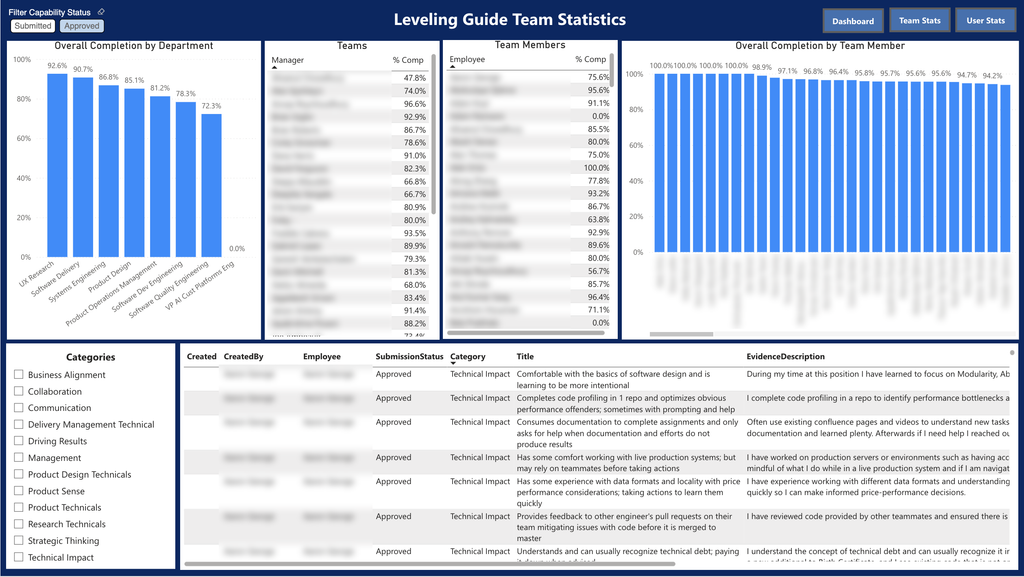
◦ Spreadsheets quickly became impractical for gathering observations and evidence of competencies for employees, requiring the team to build an application.
◦ The quality of the calibrations improved each cycle as the organization established a shared language, which also reduced the final calibration round from over 30 hours of meetings for ~50 to less than 15 hours for ~150 employees.
◦ Calibration data identified 3 skill gaps across the function – financial acumen, objective interviewing, and storytelling. Product Development leaders worked with HR to create and deliver 3 mandatory training series specifically designed for product, design, and technology people.
◦ Velocity and quality of hiring decisions improved due to the shared objective criteria.
◦ Employees highly engaged with AI automation tools reported significantly less toil gathering competencies’ evidence. Leadership safely employing AI is an opportunity to drive calibration process efficiencies.
| Key Results
Better and Faster Hires
◦ 5-7 sustained hires per month, proven with calibration data to have raised the talent bar.
Doing More for Less
◦ The 2026 pro forma Product Development budget was reduced by 16% over 2024, while adding e.commerce, contact centers, corporate API gateway, and DevSecOps automation to the portfolio.
Employee Engagement
◦ Voice of the Employee score increased from 77 to 89 with a correlation to the Leveling Guide – nearly 100% of employees reported understanding the purpose of their work and being able to connect it to business objectives (97% survey participation).
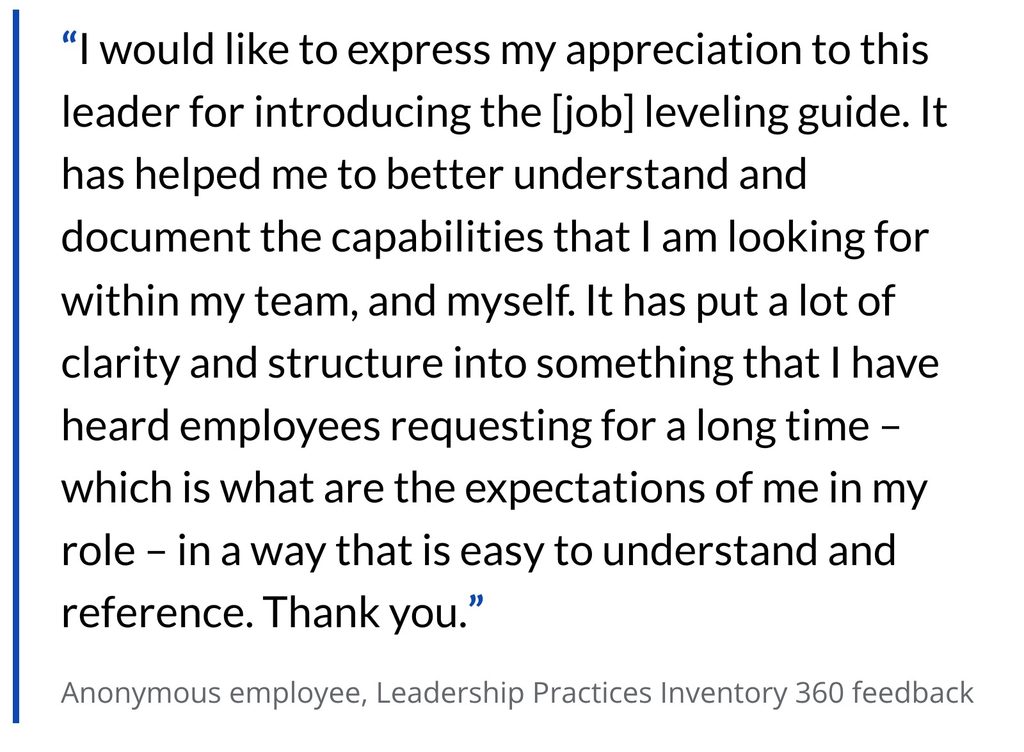
◦ “The leveling guide…lifts everyone up,” wrote an anonymous employee in the Q4 2025 Voice of the Employee survey.
Bar Raiser
◦ Bar raiser jobs reached >80% in 2026, demonstrating the expanded competencies, up from 37% in 2025.
Internal Mobility
◦ 21 employees laddered or latticed through an equitable interview process with no shoulder-tap promotions, 2.5% internal mobility as of August 2026.
Healthier Talent
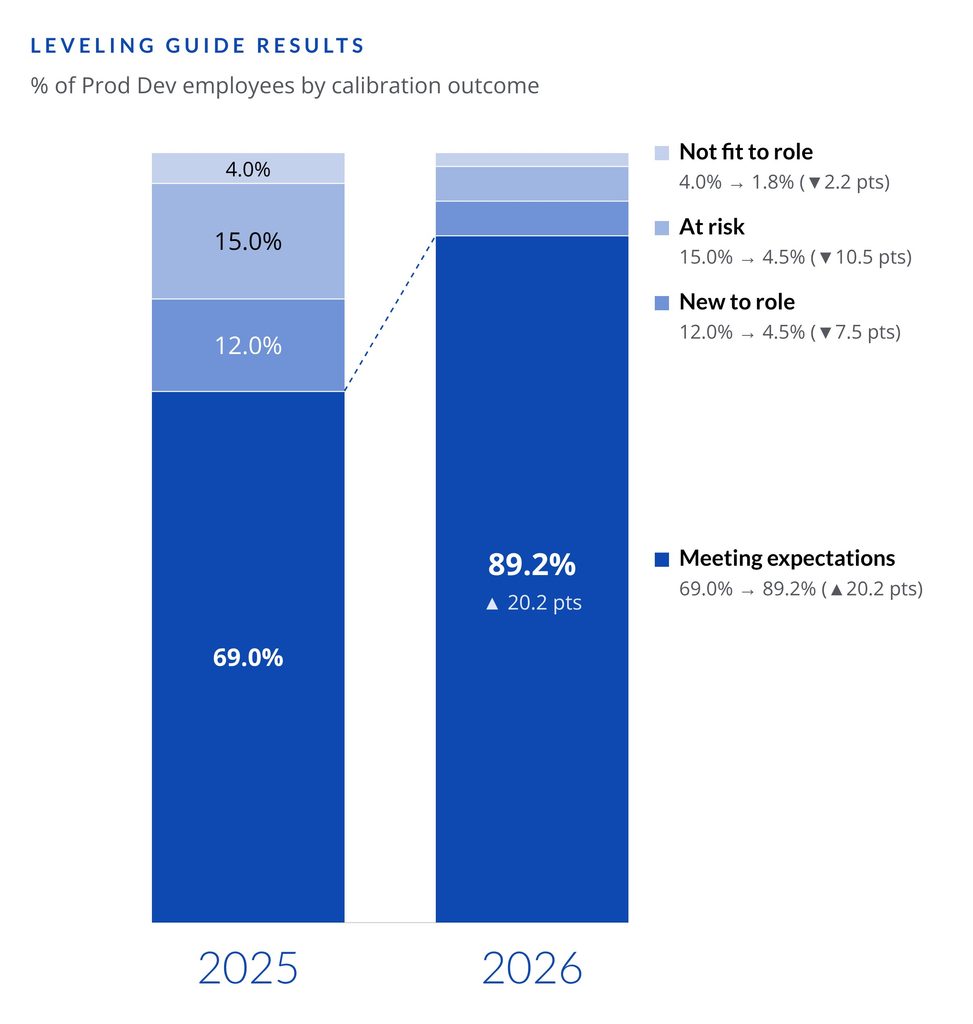
◦ 89.2% of employees meeting expectations in 2026, up from 69.0% in 2025. At risk reduced from 15.0% to 4.5% and not fit to role from 4.0% to 1.8%.
Wide Adoption
◦ The Leveling Guide was adopted by the entire CPTO organization in 2026.